
BUDGET GUIDE FOR SWISS SMES
Cost components, price benchmarks and a method for building a realistic budget in 2026.
| IN BRIEF The budget mainly depends on the scope, exceptions in your data and the level of automation you need. Licences are one component. |
A data budget covers more than licences
Asking what a data project costs is much like asking what a machine costs. The figure means little without knowing what it will do, at what capacity and with what level of reliability. We assess costs by scope, level of automation and the work needed to make your data usable.
A quote is easier to read once you know what you are buying. Is it a local prototype, a shared dashboard, a monitored workflow or a full platform? Who prepares the data, validates calculations and steps in when a source changes? These questions let you compare service levels behind the totals.
For a Swiss SME, start by asking how much reliability, automation and independence you want to achieve. The Datavizin plans show several entry points, from a free trial to dedicated infrastructure.
The amounts below are public price benchmarks checked in July 2026. Confirm them at publication and add implementation costs for your organisation’s needs before budgeting.

The total cost includes the initial project, licences, infrastructure and operations.
A simple formula for the total cost
| FORMULA First-year cost = scoping + data preparation + implementation + training + licences + infrastructure + 12 months of operations + contingency. |
This formula captures two items that are easy to miss: time spent by internal teams and operating costs after launch. Compare options over the same period and with the same assumptions about users, volumes and support.
Seven factors that affect the price
Ask for these items to appear clearly in the proposal. A very low total may assume your data is cleaner than it is, or leave out training and maintenance. A higher quote may include checks, documentation and a handover that reduce costs after delivery.
1. Project scope
Clarify the decisions to improve, users, KPIs, sources, constraints and what success looks like. A short scoping exercise costs less than weeks of development on a poorly defined requirement.
2. Data quality and preparation
Duplicates, inconsistent IDs, ambiguous dates and conflicting calculation rules all add work. The number of exceptions and the difficulty of understanding how the data is generated usually matter more than raw volume.
3. Connections and automation
A manually uploaded Excel export is quick to prototype. Connecting several ERP systems, APIs or machines with historical data, monitoring and error recovery takes more design work. Automation then reduces recurring reporting costs.
4. Model and dashboards
Page count provides a rough indication at best. Complexity comes from business rules, levels of detail, permissions and calculations. A dashboard with five validated KPIs can deliver more value than fifty charts.
5. Licences and infrastructure
At the time this article was published, Microsoft listed Power BI Pro at CHF 11.30 per user per month with annual billing, excluding VAT, and Power BI Premium Per User at CHF 19.40. Power BI Desktop remains free for creating reports locally. Sharing and certain features require the appropriate environment.
You may also need a database, storage, backups, a gateway, a server or cloud capacity. A managed plan bundles some of these items and makes costs easier to forecast.
6. Training and support
An unused report produces no return. Allow time for workshops, testing, documentation and training based on real decisions. Transferring skills reduces reliance on external support and the cost of small changes.
7. Maintenance and enhancements
Sources change, metrics evolve and access needs managing. The recurring budget covers monitoring, backups, updates, support and capacity to make improvements.
Datavizin price benchmarks for 2026
The public prices below show what it costs to get started. Custom work may cost extra. See each plan page for its scope.
| Starting point | Published scope | Prices |
| Industrial Data Starter Pack | Base model, source data workflows, preconfigured dashboards and a scoping and training session. | CHF 1,750 upfront |
| Automation and sharing | Refreshes, sharing, Swiss hosting, backups and managed maintenance. | CHF 149 per month |
| Basic Data | Shared Microsoft BI infrastructure, 5 GB, 1 user. | CHF 49 per month |
| Easy Data | Shared infrastructure, 50 GB, up to 5 users. | CHF 149 per month |
| Pro Data | Dedicated infrastructure, 100 GB, up to 15 users. | CHF 590 per month |
| Premium Data | Dedicated cluster, up to 4 servers and 100 users or more. | CHF 2,490 per month |
Prices as of 14 October 2026. Terms may have changed. See current prices on the page Our scalable, customisable plans.
Three example scenarios for planning your budget
A small SME can have a complex project if it combines several systems. A larger organisation can start with a simple use case. Set the budget according to the workflow you need to make reliable, the number of exceptions and the service level you expect.
Scenario 1 – Demonstrate value on a limited scope
Start with one main source, three to five KPIs, a small pilot group and a simple refresh. The CHF 1,750 Data Starter Pack provides a benchmark. Adding the CHF 149 monthly option for 12 months brings the example to CHF 3,538 in year one, before any extra customisation.
Scenario 2 – Share an automated dashboard with a team
Allow for several users, scheduled refresh, permissions and support. At the listed rate, five Power BI Pro licences cost CHF 678 per year excluding VAT. Data integration and model development are additional costs, so licences are only one component of the budget.
Scenario 3 – Run several sources and use cases in production
Allow for multiple systems, history, detailed security, monitoring, high availability or many teams. This becomes a scalable platform and requires a custom quote, with separate work packages and acceptance criteria.
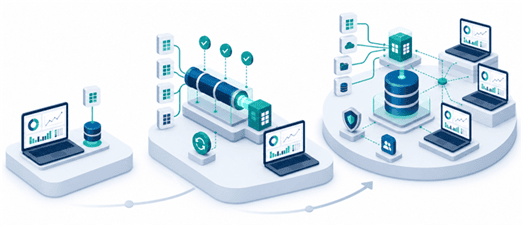
The budget can increase in stages as you add sources, automation and users.
How we reduce costs while keeping the solution reliable
Start with one priority decision and three to five KPIs. Reuse reliable sources and tools. Fix errors that affect decisions first. Deliver in short phases and validate each one with the business. Document rules, train an internal point of contact and plan operations during design.
Questions to ask before accepting a quote
Which deliverables, sources, KPIs and users are included? What assumptions are you making about data quality and access? Who pays for licences, hosting, backups and support? Are testing, documentation and training included? How are scope changes priced? Which costs recur after year one?
Calculate the return on the investment
We use conservative estimates everyone can check. Measure the time reporting actually takes, factor in corrections and estimate the value of making a decision sooner. Compare the benefits with the investment and use the result to decide whether to narrow or expand the scope.
Estimate time saved on reporting, errors avoided, faster decisions and the effect on margins, inventory or service. A report taking eight hours per month accounts for 96 hours a year. This is a starting point for estimating savings.
Include benefits that are harder to see, such as a shared set of figures, continuity when an employee is away and the ability to reuse the model for a second use case.
| NEXT STEP Start with the free preliminary audit for the Data Starter Pack to scope the work, then compare the Datavizin BI plans by number of users, automation and hosting requirements. |