
Data Strategy: the practical guide to steering your business without drowning in data
Discover Datavizin's method for turning your scattered data into an automated decision-making cockpit.Data is the cornerstone of effective decision-making. Yet many companies struggle to unlock its full potential because of fragmented systems, unclear strategies, or a lack of expertise.
Why do 80% of Data projects in SMEs fail?
Most companies jump straight to the "Dashboard" stage without building the foundations. The result: inaccurate figures, Excel files and dashboards that become increasingly cumbersome and no longer inspire trust among teams.
Vision and objectives: how do you define them, and what are they for?
A strategy is above all a vision and objectives. At the foundation of any strategy are the answers to seemingly simple questions: where are we right now? Where do we want to be in 1 month? In 6 months? In 2 years?
Now that you have a direction, you can define the vision that will get you to your destination: what is the ideal scenario that gets us where we want to be in 1 month? In 6 months?
Bit by bit, the vision emerges and naturally, your objectives will become clearer. Do you want to become a reference in your market within 5 years? To achieve that, will you need to double your customer portfolio over the next 5 years? If you currently have 100 customers, you still need to win 20 each year over the next 5 years. That means 3 customers every 2 months or 1 new customer every 18 days. In a single step, you have now defined both the objective and a first draft of the indicators to track in order to measure your progress toward that objective.
Too many teams make the opposite bet by focusing on problems before defining their direction. The result: they feel like they are standing still!
To better frame the vision and objectives of your "data" strategy, here are a few examples of questions to ask the leaders of your organization:
Which business initiatives do you want to prioritize?
✅Goal: quickly identify management's priority workstreams.
What challenges are preventing us from achieving our priority objectives?
✅Goal: define the friction points identified by management.
Which issues can be eliminated through better access to quality data?
✅Goal: define in which area(s) the "data" strategy will deliver value.
How do you measure success for yourself and your teams?
✅Goal: prepare the tools and methods to measure the success of your strategy.
A strategic "data" guide in 4 parts
With our strategic guide to transforming your business into a "data-driven business", you cover the following areas:
Data governance
Answer the "why" and the "for whom" before taking action. Build data and indicators that answer more questions than they create.
🎯Goal: a clear vision of roles and responsibilities within the organization.
Data architecture
Build your empire on central foundations (master data), but do not base your entire strategy on a single pillar (single point of failure).
🎯Goal: an architecture that is flexible, understood, and mastered 100%.
Data quality
There is no system in the world that produces clean, usable data on the first try. You decide what is useful for your business.
🎯Goal: known and documented data cleansing processes.
Data catalog & data products
Having a beautiful architecture of clean, readable data is not enough. You still need to make it available to your teams!
🎯Goal: your teams quickly find the right data they need.
87% of Swiss companies have underused data.
Are you among the 13% that turn it into a competitive advantage?
Data Strategy toolkit: for whom and why?
We designed this document as a reference guide for all organizations that want to structure their "data" strategy. Whatever your level of data maturity, your technical level, your profession, etc., you should be able to use this guide to move forward. Each section can be read independently, and our initial audit allows you to position yourself against the objectives of this guide. If you complete the self-assessment questionnaire, you will immediately receive the list of points to work on as a priority.
This guide is intended to be pragmatic, practical, and operational. Its purpose is to deliver value to you—free of charge—and action levers so that you can transform and automate your business into a "data driven business".
Build a high-impact "data" strategy in 5 steps
Datavizin's unique methodology is built around 5 steps to help organizations transform raw data into powerful, automated decision-support tools. Our approach is based on these 5 pillars: Explore, Understand, STructure, Analyze, and Act.
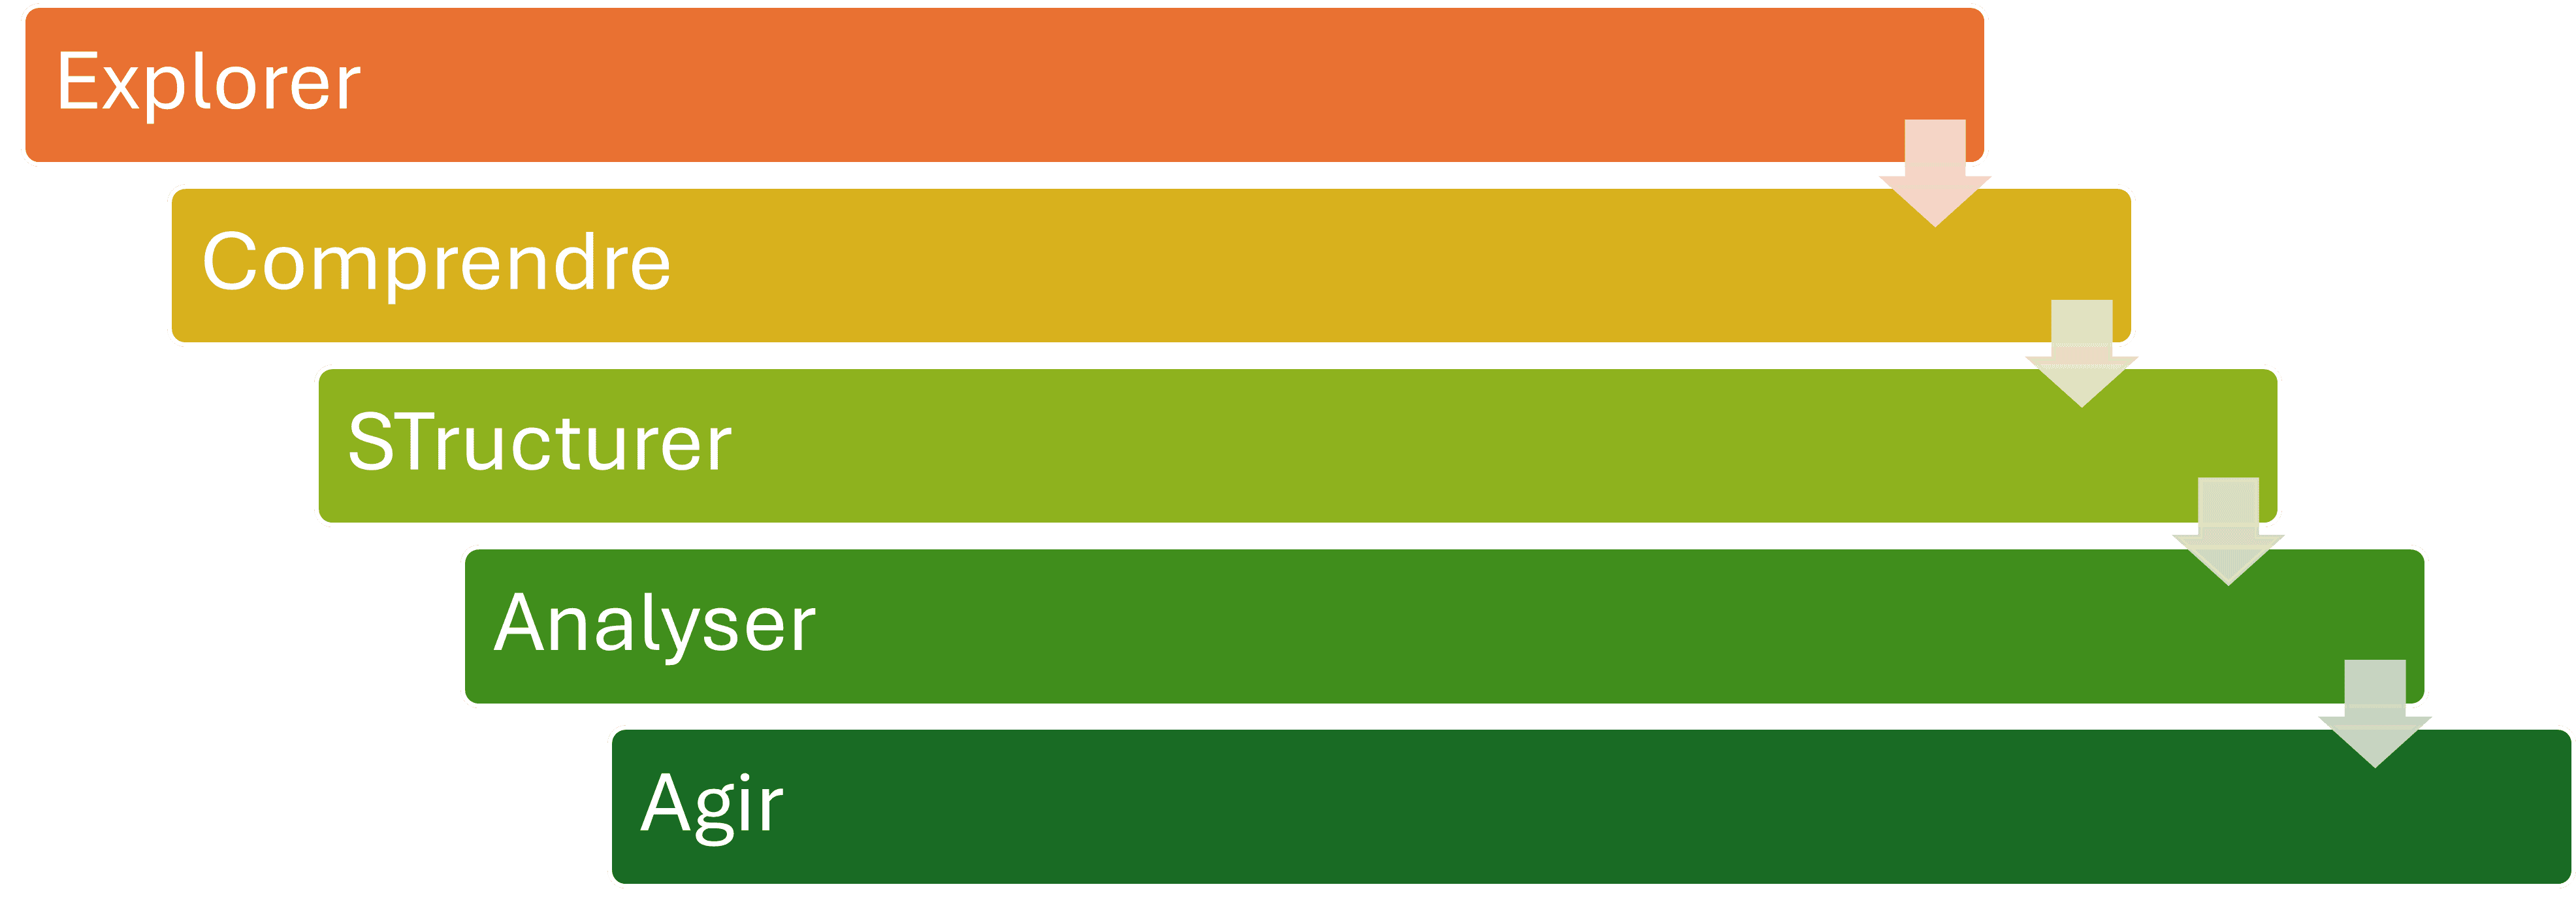
Here is how we build our "data" strategy for immediate impact:
Explore : identify and collect relevant data by examining the current systems and processes used by your company. Observe your teams in their daily operations and learn from their everyday routines.
Understand : connect the dots between your systems, solutions, and processes, and understand how your data is produced and who its true owner is. Use this step to identify the single sources of truth in your data catalog (master data).
Structure : aim for a long-term strategy. Now that you have an in-depth understanding of your infrastructure and have established your master data catalog, you are ready to build a robust architecture around your data.
Analyze : do not rush straight into the data to start creating dashboards and reports! First analyze your current situation and think about how you can monitor your operations. Now is the time to use terms such as "KPI" and "Dashboard" and define how to calculate them.
Act : this step may be the most difficult, but you have already worked hard to get here, so now it is time to act on your analysis. This is the culmination of your data journey: every data management tool must be created with the following objective in mind: implementing and monitoring strategies based on insights.
Do you want to move from strategy to execution in 10 days?
If you do not have the time to build a data infrastructure yourself, we created the Data Starter Pack.
Full audit carried out by our experts.
Deployment of your sovereign database in Switzerland.
Delivery of your first operational Power BI cockpit in 10 days.
You do not have to program anything, Datavizin handles all the technical aspects
Take stock of your data strategy
Fill out the attached form: we will get back to you within 48 business hours to schedule a video call or an on-site visit (canton of Fribourg) and jointly establish a diagnosis of your situation.

Data governance: why and how?
It is a trendy term in 2026, and "data governance" is a recurring concept in any respectable "data" strategy. Be careful, however: the concept of "data governance" is inherently vague and leaves a lot of room for improvisation and impractical theories. At Datavizin, we adopt a pragmatic approach based on operations and action. For us, there is not just one "data governance" but many "data governances" that apply differently depending on sectors, professions, maturity levels, etc.
In our view, the principle of data governance is simple: it consists of putting in place every possible means to apply the company's strategy while making maximum use of data. Put even more simply: how do we ensure that our data delivers value to our organization?
At first, forget the technical terms, Data Products, Data Architecture, Master Data, etc., and focus on what matters most: what do we need so that our data brings value to our company?
Data Governance will in particular help define who in the organization is responsible for which data, and who can serve as support, relay, or backing for your organization's "data" strategy. This central element applies whatever your size and whatever your profession. In other words, Data Governance defines the who and the why before looking at the how.
Here again, we have too often seen organizations rush into execution before asking the main questions. The result: a state-of-the-art architecture, but tools that are too expensive and unsuited to the company's real needs.
Architecture: central foundations, but do not base your entire strategy on a single pillar
Data architecture is the central point of the entire data strategy, and it is one of the key elements of our Data Strategy Toolkit. With a clear vision and a broad definition of the who and the why, you know what you need to build, for which audience, and for what purpose. And that changes everything.
You can base your data architecture on Excel files. If the strategy is clearly defined upstream, it will work. Of course, we can still suggest alternatives that are a bit more powerful and automated than Excel!
The question of the data stack will of course arise! You can choose to build your own infrastructure, dedicate part of your existing datacenter resources (if you have one) to Business Intelligence, or trust an external provider such as Datavizin to offer you a managed, turnkey infrastructure.
Unpopular opinion: the choice at a given moment is not the most important point. What we recommend that you put in place from the very beginning is:
- A fallback strategy: which architecture should be adopted if Plan A fails?
- A flexible architecture: do not put all your eggs in one basket.
- Understand how your infrastructure is built. Ask questions of your IT department, your suppliers, etc., but make sure you know how your data works.
The foundation of a data architecture is:
- A database
- A tool for writing data
- A tool for reading data
That is all. The rest (medallion architecture, ETL, ELT, etc.) is detail at this stage of operations. If you need to start with the simplest approach, focus on the concept of a database.
Data quality: an ongoing effort for every team.
Goal: build a "data culture" and a "data driven business"
Data quality is a topic as recurring as it is vague in the world of "data." Beyond the big concepts and complex theories on the subject, keep in mind that the main objective is for you to be able to interpret the data available to you. For optimal reading and analysis, we generally prefer a calm environment.
The main activity here will therefore consist of eliminating all the "background noise" from your datasets, tables, and charts. The important point is that you redefine these notions of "noise" and "waste." Before moving on to cleaning proper, you will therefore need to clearly define what "clean" or "usable" data is. In short, you will define a number of rules for each domain, and your data team will ensure that these rules are applied as effectively as possible to your data.
Be careful: this is where major biases can be created! Above all, do not fall into the trap of over-sanitization: some data is not "bad data," but weak signals that absolutely must be integrated into your analysis.
For example, for a CRM: if 80% of your prospects' email addresses are missing from your database, that is a sign that you need to thoroughly rethink your email acquisition method!!
Data catalog and data products: for whom, by whom, and how?
The notions of "data catalog" and "data products" have one thing in common: they rely on a logic of centralization and standardization of data.
To take an example, if you manufacture bicycles, you will buy some parts, produce others, and assemble these parts together to obtain a finished product.
Before you get to a fully operational bicycle, you will set up several intermediate steps, and for each of these steps you will use parts. These parts each have their own characteristics, and every stakeholder—from the buyer to the workshop manager to the handler—will mainly focus on the characteristics they need to do their job. The buyer will mainly be interested in price, availability, suppliers, etc., while the workshop manager will want to know more about size, weight, the color of the part, etc.
Thus, each stakeholder will tend to use the system or tool that gives them the information they need most as a priority, even if that means ignoring all the other aspects of the part. This is a known and documented phenomenon, which ultimately leads to fragmented information across the company's different systems and applications. This situation quickly causes frustration and a lack of trust in the various systems being used, but it also has more serious consequences: stock errors, problematic sales caused by duplicate customers, decisions made on incomplete data, hours lost searching for the "right" technical information, etc.
To avoid these very business-specific issues, data professionals use "master data," "data catalogs," or "data products": to guarantee a single source of truth for all company stakeholders. It is often foundational work whose virtues and benefits are not very visible, but are essential for a high-impact "data" strategy.
A good data catalog is like a shared technical specification sheet for the entire company. Everyone finds what they need there, without confusion or wasted time. And it is this foundation that then makes it possible to produce reliable dashboards, launch AI projects, or simply... manage better.
Get started with the industrial Data Starter Pack
In 10 business days, we set up a first simple but robust BI cockpit, based on your real data. The pack includes:
Free pre-audit (1h)
A video call (or visit in the canton of Fribourg) to understand your context, your systems, and your priorities.
🎯Goal: quickly identify whether the Starter Pack is suited to your situation.
Audit & scoping
Mapping of your systems, your data exports, and your key processes (sales, production, stock).
Together, we define 3 to 5 industrial indicators to highlight (available stock, orders, lead times, etc.).
Data modeling and centralization
Implementation of a simplified data model by our Business Intelligence experts to bring together your Excel, ERP, MES / PLM data, etc.
It is the foundation of your future BI platform.
Creation of your Power BI cockpit
A ready-to-use dashboard with:
– Summary view: stock, orders, sales, margin
– A few simple filters (period, product family, customer)
– Detailed views (order list, stock by item, etc.).
Training & handover session (2h)
A video session (or on-site in the canton of Fribourg) to show you how to read, filter, and use your cockpit.
You leave with an operational demonstration for your teams and your management.
Recommendations for what comes next
A mini action plan to go further: other data flows to connect, automation, hosting, scaling up.
Move to Self-Service BI!
To go further in implementing a "data" strategy, move to Self-Service BI right now!
Become a true data-driven business by developing your own data management and analysis platform.
Datavizin supports you in this approach by offering a Microsoft BI infrastructure hosted in a sovereign cloud.