
A PRACTICAL GUIDE FOR SWISS SMES
A staged migration that automates reporting, improves the reliability of metrics and preserves useful ways of working.
| IN BRIEF A move to BI can include Excel. We put recurring calculations and refreshes into a reliable workflow and keep Excel where its flexibility helps. |
Moving from Excel to BI while preserving what works
We rarely advise an SME to drop Excel overnight. It remains an excellent tool for exploration, simulation and one-off questions. It becomes fragile when one workbook has to retain the history, consolidate several systems, apply business rules and share official figures. Moving to BI gives each of these tasks a suitable home.
Start with a report your teams know well. We look at how they create it, what they correct manually and which decisions it supports. This reveals both the business rules the new model needs and the useful practices worth keeping.
A move to BI should address these weaknesses while preserving the team’s ability to analyse data. At Datavizin we examine the real process, structure the data it uses and build a dashboard that fits the need.
Our service page also explains how to automate Excel reporting with Power BI. This guide focuses on what to move, in what order and which checks you need.

Keep the flexibility of Excel while centralising data flows and metrics in BI.
Identify what your teams rely on Excel to do
We look at the work Excel has to support. Personal analysis is a good fit. A critical consolidation process that only one person knows and the entire company depends on is a risk. BI can make that process shared, traceable and repeatable.
A workbook fits personal analysis, a simulation or a simple list. It is less suited to acting at once as a shared database, an integration tool, a calculation engine, a historical record and a channel for distribution.
BI separates those responsibilities. Source data stays in your ERP, CRM, files or databases. A controlled workflow prepares the data, a shared model holds the definitions and a dashboard provides a consistent view of the metrics.
1. Map workbooks and their dependencies
Start with files that teams use for recurring decisions. Record each owner, location, refresh frequency, data sources, macros, external links and who uses the output.
Focus on the steps that produce a priority report. A file can be an official source, a transformation step or an output. Document its role.
Identify source files and working copies. Note critical formulas, queries and macros. Name the business owner for each important data item. Measure preparation time and manual corrections.
2. Define KPIs and systems of record
This is often the hardest step because it exposes differences in terminology. Does “sales” mean orders, deliveries or invoices? We agree on the rules before migrating. Otherwise the same debate follows you into the new tool.
Validate three to five metrics before rebuilding the report. Specify their formulas, level of detail, frequency, targets and the decisions they should inform. This helps prevent inconsistencies in Excel from carrying over into Power BI.
Name a system of record for each critical field. For example, use the ERP for orders, the CRM for contacts and accounting for approved entries. You can use supporting files if you document their role and exceptions.
3. Separate the source, transformations and report
Keep a copy of the raw data, clean it in a separate layer and then feed it into the reporting model. This makes it possible to trace a figure, test a rule and fix an anomaly without manually editing the final output.
Power Query can be enough at first. When you need to combine multiple systems, retain history or refresh the data independently of someone’s computer, consider a data mart, SQL database or dedicated pipeline.
4. Build a reusable data model
The model should reflect business events such as sales lines, stock movements, production orders or accounting entries. These facts link to stable dimensions such as customers, items, sites and dates.
Calculate measures such as revenue, margin, quantity and lead time once in the model. This makes the dashboard more consistent, improves performance and makes later changes easier.
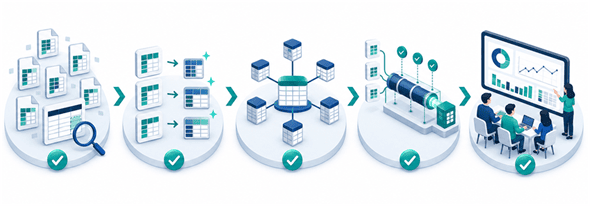
A successful migration combines an inventory, data quality, modelling, automation and adoption.
5. Choose how to share the reports
Power BI Desktop lets you create a report locally. When several people need a shared version, updates or access from somewhere other than the author’s computer, plan for a publishing service, permissions and a refresh setup.
The Datavizin self-service BI service provides a managed Microsoft stack hosted in Switzerland. The choice between cloud, an on-premises server and a managed environment depends on user numbers, security requirements, your sources and how much you want to manage internally.
6. Run old and new reporting in parallel
Set an end date and a purpose for the comparison. We pick representative periods and include an unusual case, then document each difference. We switch over once the rules are understood and users trust the numbers. Keeping two official versions indefinitely brings back the problem the migration was meant to solve.
For a short period, produce both versions and compare results. Explain each difference, whether it comes from scope, refresh timing, calculation rules, manual corrections or data quality.
Use the parallel run to build confidence, validate definitions and set a switchover date. Then archive the old files as read-only to prevent new competing versions.
7. Train users around their decisions
Train users on realistic scenarios. Have them identify a drop in margin, filter by site, interpret an alert or drill down to an order. A tour of all the features cannot replace this practice.
Set a regular routine. Decide who reviews the dashboard, when, which decisions it supports and how change requests are prioritised. This is how reporting becomes part of running the business.
Checklist before retiring an Excel report
KPIs have approved definitions and business owners. The numbers reconcile across representative periods. Refreshes, checks and failure alerts are documented. Permissions reflect users’ roles. Pilot users can explain the main differences. A support and change process is in place.
How we measure the success of the migration with you
Track preparation time saved, manual corrections, frequency of use, time to obtain a reliable figure and decisions made sooner. These measures are more informative than counting the workbooks you retired.
A good migration leaves teams more independent. They understand the metrics, can trace transformations and can reuse the same foundation for the next use case.
| NEXT STEP The Data Starter Pack helps scope a first dashboard using your existing files and systems. If you already have a need in mind, request a Power BI audit in French-speaking Switzerland. |