
A PRACTICAL GUIDE FOR SWISS SMES
A staged approach to removing duplicates, automating consolidation and creating a reliable data source.
| IN BRIEF We separate data sources, rules and reporting so you can trace and share every figure. |
When Excel becomes an unseen information system
Centralising data raises questions about access. Some users need only a subset of the rows, a point that can be easy to overlook when you share a file. We use the project to clarify who can view, correct and approve data. Permissions then become a clear rule of your process from the start.
Archiving and backing up meet different needs. An archive retains a useful version for understanding the past. A backup lets you restore operations after an incident. A central database needs both. Otherwise removing visible copies may do little for operational continuity.
Excel files rarely multiply through neglect. They appear because someone has to meet a local need quickly. Trouble starts when your revenue, inventory or lead times depend on a string of files nobody sees as a whole. We centralise what needs to be shared in stages so your teams can keep working.
Combining every workbook into one big file leaves the same fragile formulas and unclear ownership in place. We separate sources, transformations and reporting so each figure can be traced without relying on one person’s knowledge of the entire workflow.

We replace manual consolidation with a controlled workflow, a central source and a shared view.
This follows the practical approach we use at Datavizin : start with a business need, structure the data you need and build a solution that fits.

From scattered Excel files to a central database and a dashboard.
Map the workflow before merging files
We trace an important figure before moving any files. Who enters and corrects it? Which workbooks transform it, and where does it appear? This often uncovers a forgotten manual step or one person on whom the whole process depends.
List the files in use, their owners, how often they are updated and which decisions they support. Two files with the same name can apply very different rules.
Identify duplicates, dependencies and critical files that only one person knows. Use this map to choose a first area without interrupting work.
Identify the systems of record
A system of record is the source you have agreed to trust for a specific piece of information. Decide who resolves discrepancies too. This prevents two competing corrections from persisting in separate files.
Choose a reference source for each important data item. For example, use the ERP for orders, the CRM for contacts and the accounting system for approved entries.
Other files can enrich or correct the data temporarily. Document these exceptions and reduce them over time.
- One system of record per domain.
- One business owner.
- One rule for resolving discrepancies.
Clean keys and standardise formats
Start with fields that link data, such as customer IDs, product codes, dates and units. A typo in a comment has little effect. An inconsistent key can exclude entire sales from reconciliation. Set priorities by the impact of errors.
Inconsistent identifiers often cause centralisation to fail. Customer codes differ, product names are entered freely and dates and units vary. Address these linking fields first.
Build mapping tables if the source systems cannot be corrected immediately, then monitor new anomalies.
Automate imports and retain history
A reliable refresh needs to report when it fails. We check that the expected file is present, the period is complete and data volumes look plausible. Your teams can then use the dashboard without wondering each morning whether someone remembered to paste the latest data.
Power Query, connectors, ETL or simple flows can replace manual copying. Load data into a database or data mart and transform it using repeatable rules.
Keeping historical data lets you explain changes and prevents updates from overwriting the past. This is a major advantage over a workbook you continually replace.
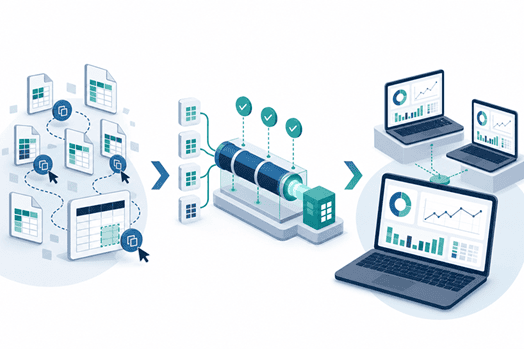
Replace manual copying with a controlled pipeline and shared dashboards.
Build a shared model and dashboard
Once the data is centralised, join it in a model that users can follow, such as sales facts and customer, product and date dimensions.
The Data Starter Pack uses sources you already have, such as Excel, ERP, MES or databases, to create a simplified model and a first Power BI dashboard you can build on.
Make the transition while teams keep working
We compare old and new reporting for a short period. Each discrepancy is a chance to validate a rule. Once users trust the figures, we set a switchover date and archive old versions so they do not reappear at the first sign of doubt.
Run old and new reporting in parallel, compare the results, document differences and train users before removing any files.
Once the dashboard is validated and in regular use, archive obsolete files and prevent new competing versions from appearing.
Where to start
Choose a time-consuming consolidation step everyone knows, such as weekly order tracking. We follow a complete cycle, validate the systems of record and automate that flow first. Your teams can compare the result with the old file, flag differences and make decisions on a concrete basis. You can then reuse the method for inventory, finance or production.
The best next step depends on a well-defined scope, available data and committed users. A short workshop can often confirm all three.
| NEXT STEP See how the Data Starter Pack brings together Excel, ERP and other business tools, or review the Datavizin BI plans for options to automate updates. |