
Clear safeguards for a dependable data foundation
| IN BRIEF Self-service BI gives people more independence through a shared foundation: prepared data, validated measures, clear permissions and training rooted in real work. |
Give people a framework they understand so they can explore and create with confidence. Provide prepared data, common definitions, clear permissions and someone to ask when a figure is unclear. That shared foundation makes independent work possible.
Successful self-service means a business manager can answer a routine question without raising a ticket and use the same definitions as management. It reduces waiting time and keeps files and calculations from fragmenting.
In a traditional centralised model, each new question goes to IT or an analyst. Waiting times grow, and business teams sometimes turn to their own files. Self-service BI makes routine exploration accessible while protecting definitions, sensitive data and critical reports.
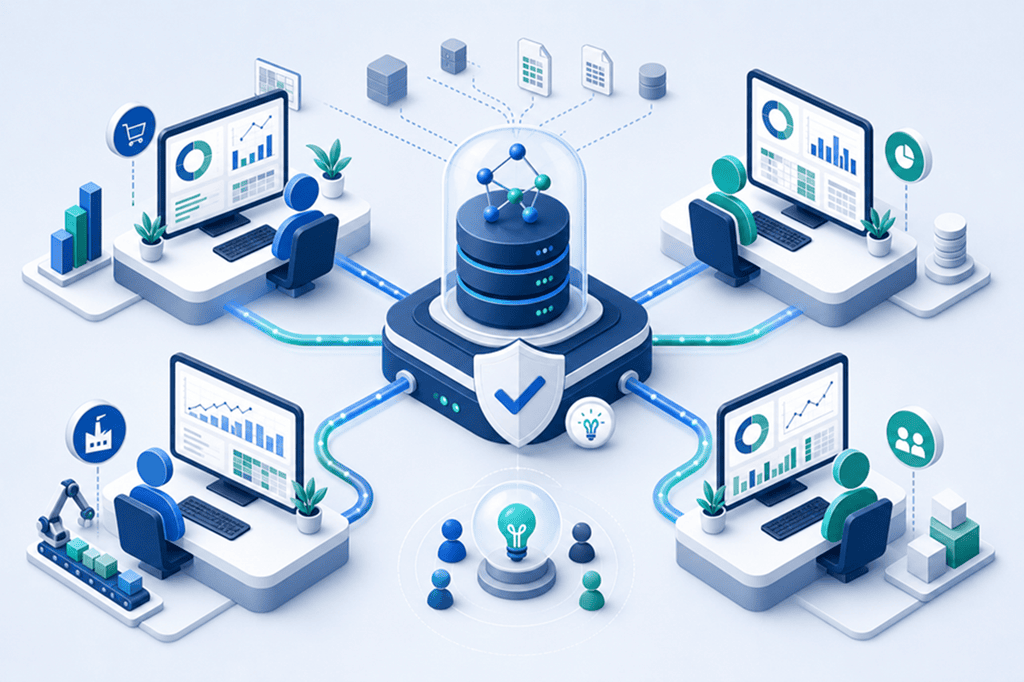
Teams can work independently over time when they rely on the same dependable foundation.
What self-service BI means in practice
Think of self-service as a well-prepared kitchen. Your teams can put their own analyses together because the ingredients are labelled, prepared and easy to find. Without a shared foundation, people repeat the same data cleaning and soon have several versions of revenue.
Self-service BI allows business users to view, filter and sometimes build reports without asking a technical team for every change. A small group of specialists prepares the data and models. Authorised users build views for the decisions they make.
Three levels of independence
| Level | What users can do | Main safeguard |
| Use a report | Filter, explore and export a published report | Read permissions and suitable data |
| Build a report | Create a view on a shared model | Build permission and a certified model |
| Prepare data | Connect and transform new sources | Advanced training, review and a controlled workspace |
The foundation is a shared semantic model
A semantic model puts data in the language your business uses. Users find concepts such as Customer, Product, Order and Margin, with relationships and measures already validated. Readability lets people create reports without having to understand how each source works.
A semantic model turns technical tables into business concepts with shared relationships, measures and formats. Microsoft lets you share access to a model and grant Build permission so multiple people can create reports from the same foundation. This keeps calculations from being duplicated across files.
Check that your model has the following:
- Clear business names and hidden technical fields.
- Validated measures for official KPIs.
- A date table and shared dimensions.
- Visible descriptions and owners.
- Monitored refreshes and tested security.
Roles that keep self-service running
The business sponsor
Sets the objective, resolves competing priorities and makes time for training. Without a sponsor, self-service remains a set of individual initiatives.
The data owner
Approves definitions, access rules and quality thresholds for their domain. They may not build reports, but they are responsible for consistency from the business perspective.
The model owner
Maintains sources, transformations, relationships, measures, refresh and security. A critical solution should have at least one deputy.
Business report creators
They build reports on approved models and follow publishing rules. Training covers data interpretation and design as well as how to use the tool.
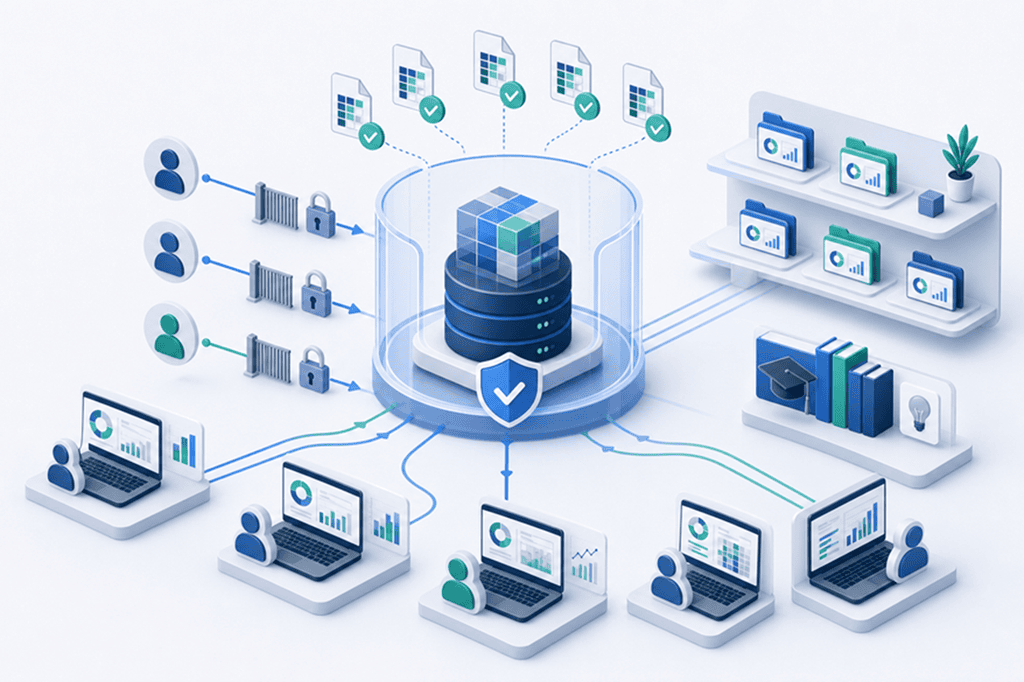
Safeguards protect the shared foundation while giving teams room to build the views they need.
Minimum safeguards
Here are the basics to put in place:
- Personal workspaces for learning, team workspaces for collaboration and production workspaces for distribution.
- A naming convention and a named owner for everything published.
- Approved or certified models that users can identify in the catalogue.
- Row-level security tested with representative accounts.
- A straightforward review before wider distribution.
- Archiving unused reports and transferring ownership when people leave.
- A set of visual templates and accessibility rules.
We train your teams on real tasks
General training can show users the buttons. Useful training helps someone answer a real question, such as explaining a stock discrepancy or comparing a region with its target. Users learn each feature when they need it and see where the model’s limits are.
Use your company’s own data for exercises. Ask people to analyse a discrepancy, build a view by area, check a total and publish to the right workspace. Teach them to recognise incomplete data and request a correction.
The Power BI training for businesses page explains Datavizin’s approach. An internal community, short drop-in sessions and a few champions in business teams help people keep learning.
Roll out in three waves
Wave 1. One use case and a pilot team
Choose a visible process, three to five KPIs and a motivated group. Build the central model with them and observe what questions they actually ask.
Wave 2. Give a small group permission to create
Grant Build permission on the model to a small group. Review reports and document requests that require changes to the shared foundation.
Wave 3. Broaden access in a controlled way
Extend approved models, formalise workspaces and measure adoption. Keep governance proportionate so people know the rules and can still get an answer quickly.
How to measure independence
We track time to an answer, the number of straightforward requests sent to IT and the share of reports reusing certified models. More report files can bring back competing definitions. The aim is to make the system simpler to use and maintain.
Track these indicators:
- Average time from a question to a usable answer.
- Share of reports built on a shared model.
- Number of duplicated or disputed KPIs.
- Active users and how often the report informs decisions.
- Refresh success rate and time to resolve incidents.
- Trained creators who can take over an existing report.
Datavizin offers a self-service BI platform and a Data Starter Pack to establish the initial foundation and help teams take over.
| NEXT STEP Choose a shared model and two business report creators. Give them a test workspace, publishing rules and a real question to solve. Measure how long they take and how good the answer is. |